Synthetic robot data just went from a research trick to a default. NVIDIA's Cosmos 3 generates action-conditioned trajectories from text and video; the Isaac GR00T blueprint reportedly produced 750,000 synthetic trajectories in 11 hours, and mixing that synthetic data with real demonstrations gave a +40% policy improvement over real-only. If you train robot policies, some of your data is about to be generated, not collected.
Which raises a question almost nobody measures: is that synthetic data actually diverse, or is it 750,000 variations of five scenes? You can't tell by eyeballing it — nobody scrubs through 750K episodes. And it matters, because the reason synthetic+real helps is coverage. A generator that quietly collapses to a handful of situations gives you volume without variety, and your policy memorizes instead of generalizes.
So we built the measurement — a per-episode visual embedding layer with a diversity check — and pointed it at NVIDIA's own synthetic data.
What we ran
We used nvidia/PhysicalAI-Robotics-Manipulation-Objects: bimanual pick-and-place in procedurally generated kitchens, rendered in IsaacSim with optimization-based motion planning. It ships in LeRobot v2.1 across three task subsets — pick (272 episodes), place_bench (142), place_cabinet (126) — 540 episodes total.
For each subset we embedded the fixed world-camera RGB view (every 5th keyframe through DINOv2 ViT-B/14), then ran our existing dataset CI with --ml:
python -c "from traceplane.frame_embeddings import compute_frame_embeddings; compute_frame_embeddings('./pick', stride=5)"
traceplane check ./pick --ml
Two checks run on the embeddings: a near-duplicate cluster check (episodes whose frames are ≥ 0.95 cosine-similar) and an outlier flag (k-NN distance, z-scored across the dataset).
What we found
| Subset | Episodes | Near-duplicate clusters (cos ≥ 0.95) | Outliers (z ≥ 2.0) |
|---|---|---|---|
pick | 272 | 0 | 11 |
place_bench | 142 | 0 | 5 |
place_cabinet | 126 | 1 (a single pair) | 5 |
Near-zero visual redundancy. Across 540 episodes there is exactly one near-duplicate pair (two episodes in place_cabinet). Every other episode is visually distinct from every other episode at our threshold. NVIDIA's procedural pipeline is doing real work: it's varying walls, floors, cabinetry, object placement and lighting, not re-skinning one kitchen.
That lands harder against the contrast. When we ran the same check on the most-trained-on public LeRobot datasets, the scripted single-scene sim datasets collapsed: lerobot/pusht put all 206 episodes into one cluster, aloha_sim_transfer_cube all 50, xarm_lift_medium all 800. NVIDIA's synthetic data behaves like the one genuinely multi-task set in that study (libero), not like the scripted ones.
You can see it:
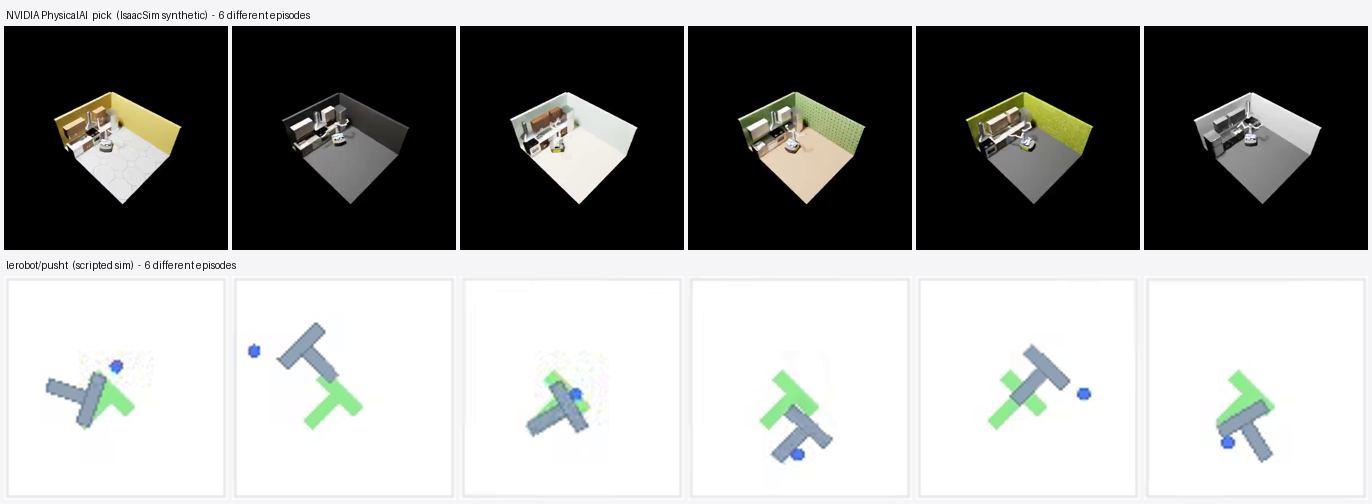
nvidia/PhysicalAI pick — six procedurally different kitchens. Bottom: lerobot/pusht — six episodes that are nearly the same image. This is not "NVIDIA pretty, pusht ugly" — pusht is a deliberately minimal benchmark. The point is that the cosine-cluster metric puts a number on what your eye sees, so you can verify variety on a dataset far too large to eyeball.
To be clear about what this is and isn't: a photoreal kitchen renderer will obviously look more varied than a 2-D pushing toy, and a single fixed camera only sees scene-level diversity, not subtle manipulation differences. The finding isn't "synthetic beats scripted." It's that the metric agrees with reality — it flags collapse where collapse exists and confirms variety where variety exists — which is exactly what you need when a generator hands you hundreds of thousands of episodes and a claim that they're diverse.
The outliers (11 / 5 / 5, top z = 3.6) are the second signal: a small set of tail episodes per subset that sit far from the bulk — unusual camera angles or object configurations. Not defects; a curation signal, telling you which configurations your policy will have seen few examples of.
We ran our own QA on NVIDIA's data, and our checker tripped
Worth telling, because it's the same lesson as last time. On the first pass, traceplane check raised a hard DATA_ACTION_DIM_MISMATCH error on every subset: info.json declares action dim 34, but the data has dim 1. If you stopped there, you'd write a headline about NVIDIA shipping a broken schema.
We didn't stop there — we looked at the actual Parquet. The action column is fixed_size_list<float>[34]: a clean 34-dimensional action, exactly as declared. NVIDIA's data is correct. Our checker was wrong. It only read the list length for LeRobot v3; for v2 it counted columns named action, found the single list-encoded column, and reported "dim 1." Modern LeRobot v2.1 (and NVIDIA's sets) list-encode actions the same way v3 does — our check pre-dated that.
We fixed it (a version-agnostic dimension read), added tests, and re-ran: the false error clears and the diversity numbers above are unchanged. The meta-lesson is the one we keep relearning: a QA tool is only as trustworthy as its last encounter with real data. Always check whether the check is right — especially before you publish a claim about someone else's dataset.
Reproduce it
Everything here is in the open-source traceplane package:
pip install 'traceplane[vision]'
# per task subset:
python -c "from traceplane.frame_embeddings import compute_frame_embeddings; compute_frame_embeddings('./pick', stride=5)"
traceplane check ./pick --ml
Why we care
We're building the data platform that sits above the generators. NVIDIA (and others) are making synthetic robot data a commodity; what's missing is the layer that catalogs it, measures it, and tells you whether a given batch is worth training on — diversity, redundancy, tail coverage, and the real-vs-synthetic mix. Diversity is the first such measurement, and "good synthetic data" turns out to be a thing you can quantify, not just hope for.
Generating or training on synthetic robot data?
We'll run the diversity, redundancy, and tail-coverage checks over your own datasets — real or synthetic — and send back the report.
Request early accessCitations & acknowledgements
nvidia/PhysicalAI-Robotics-Manipulation-Objects— NVIDIA, released under the NVIDIA OneWay Noncommercial License for research. We report aggregate QA metrics on the public dataset as commentary; we do not redistribute the data. This is not a critique of the dataset — the diversity result is a credit to its generation pipeline.- DINOv2 — Meta AI Research.
- Prior posts: We put a vector layer over 5 popular robotics datasets and We audited the most popular public robotics datasets.